
How to turn an article into an infographic
A practical guide to deciding what should survive when an article becomes visual.
Read guideAI infographic format
An AI infographic maker turns source material into a visual explanation built around relationships, sequence, hierarchy, or contrast. FormaLM starts with the information and the job it needs to do, then shapes that material into an infographic structure that is ready to review and refine.
Product facts reviewed
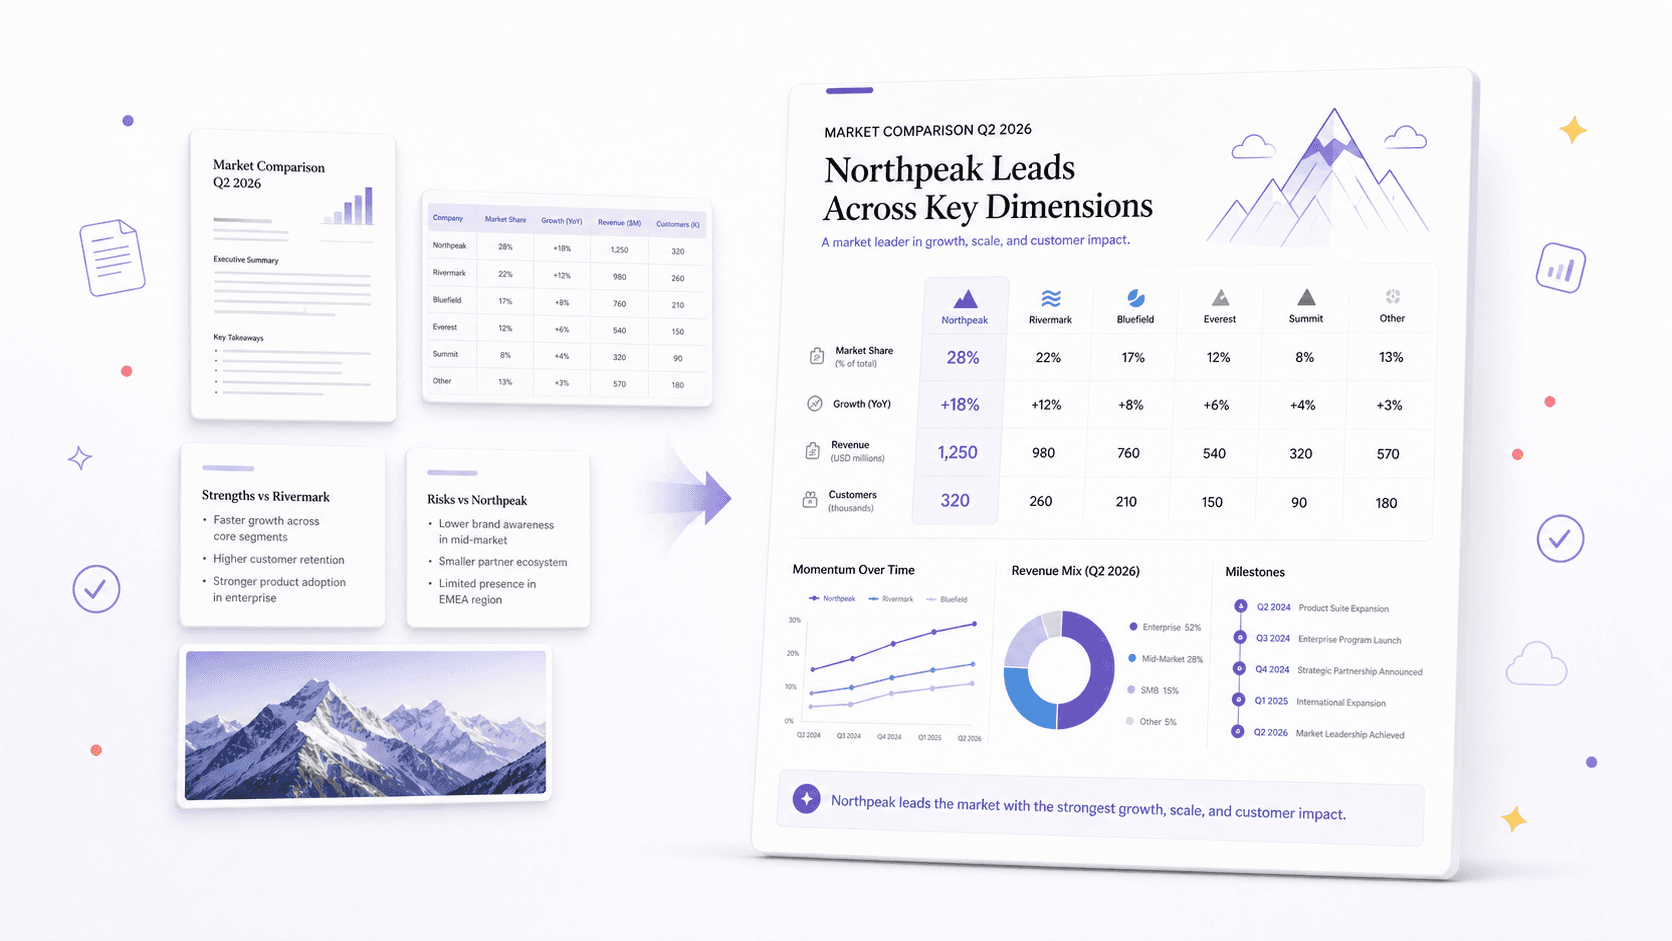
Choose an infographic when the reader needs to understand a system, comparison, sequence, or process at a glance.
Choose an infographic instead of a carousel when the relationships should be visible together rather than revealed one slide at a time. Choose it instead of a web page when scanning the whole structure matters more than preserving extended reading context.
These examples show different ways to use the same format.
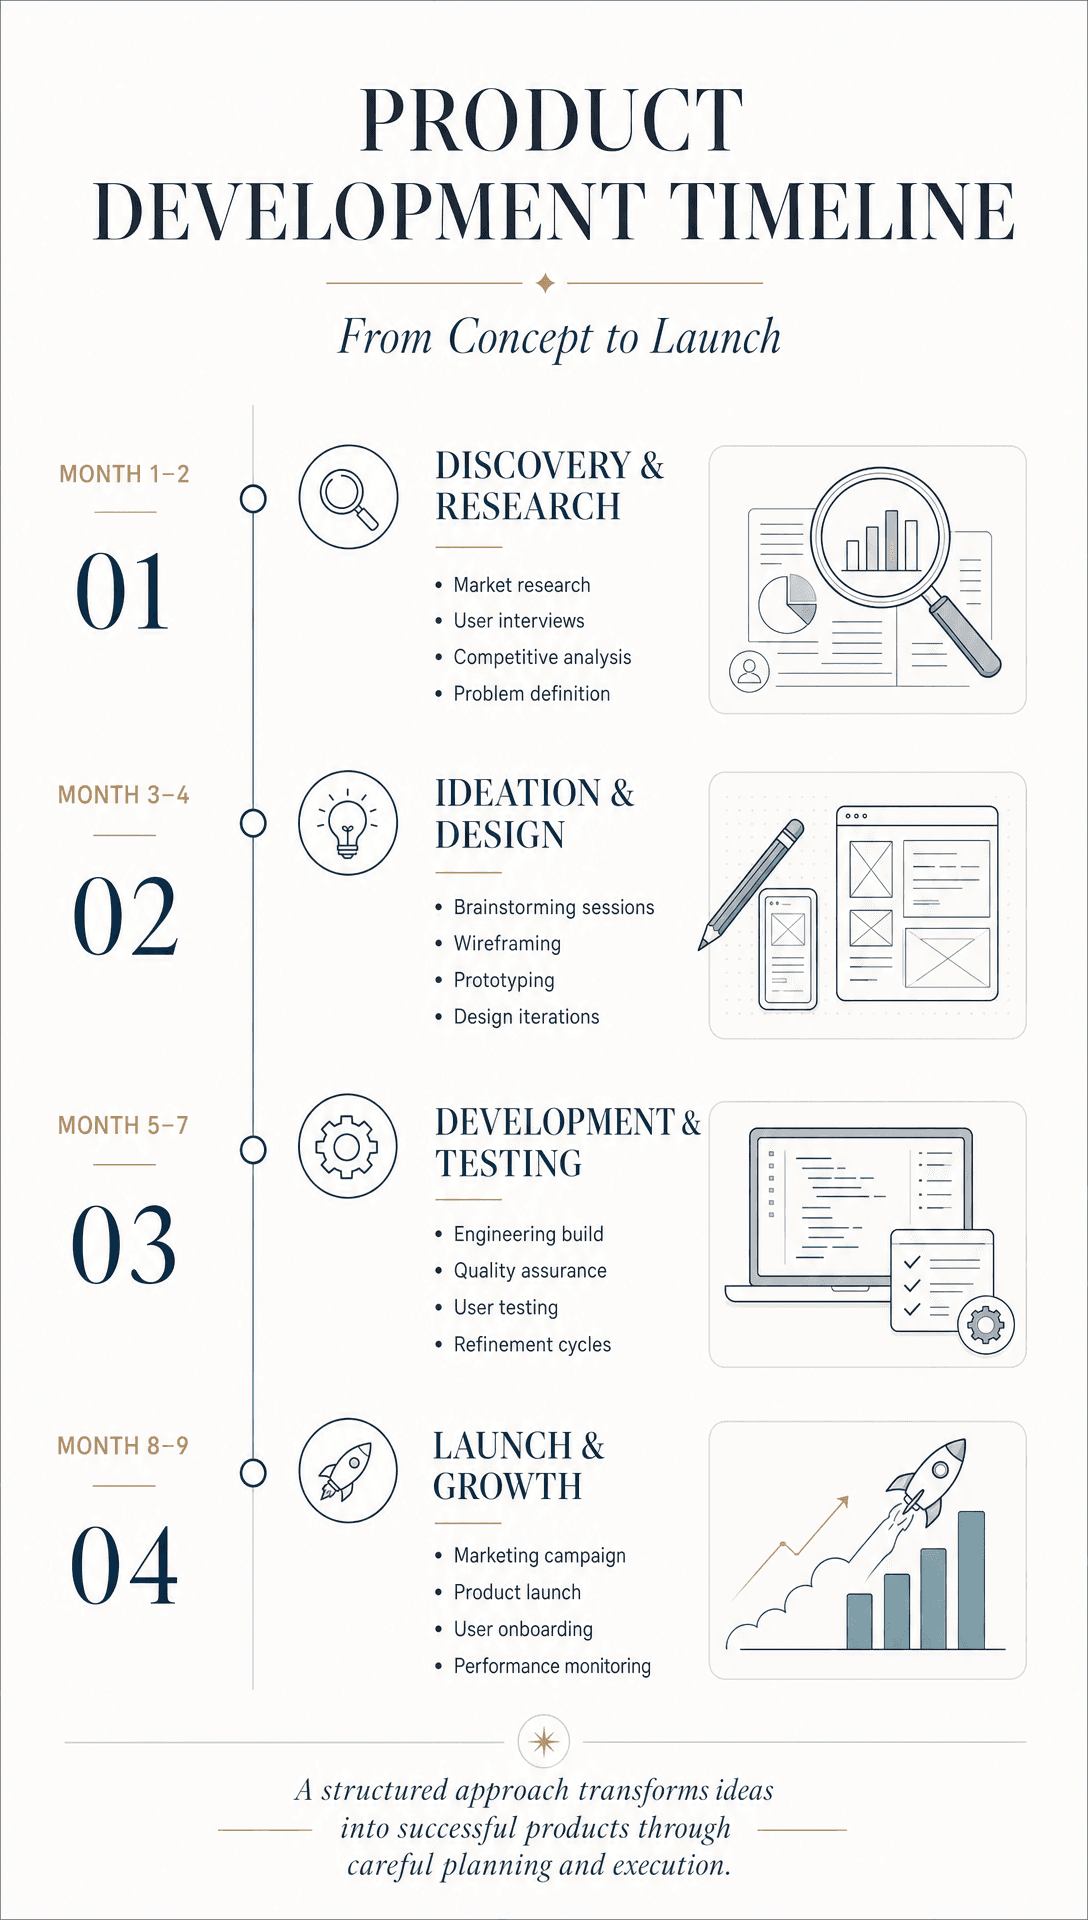
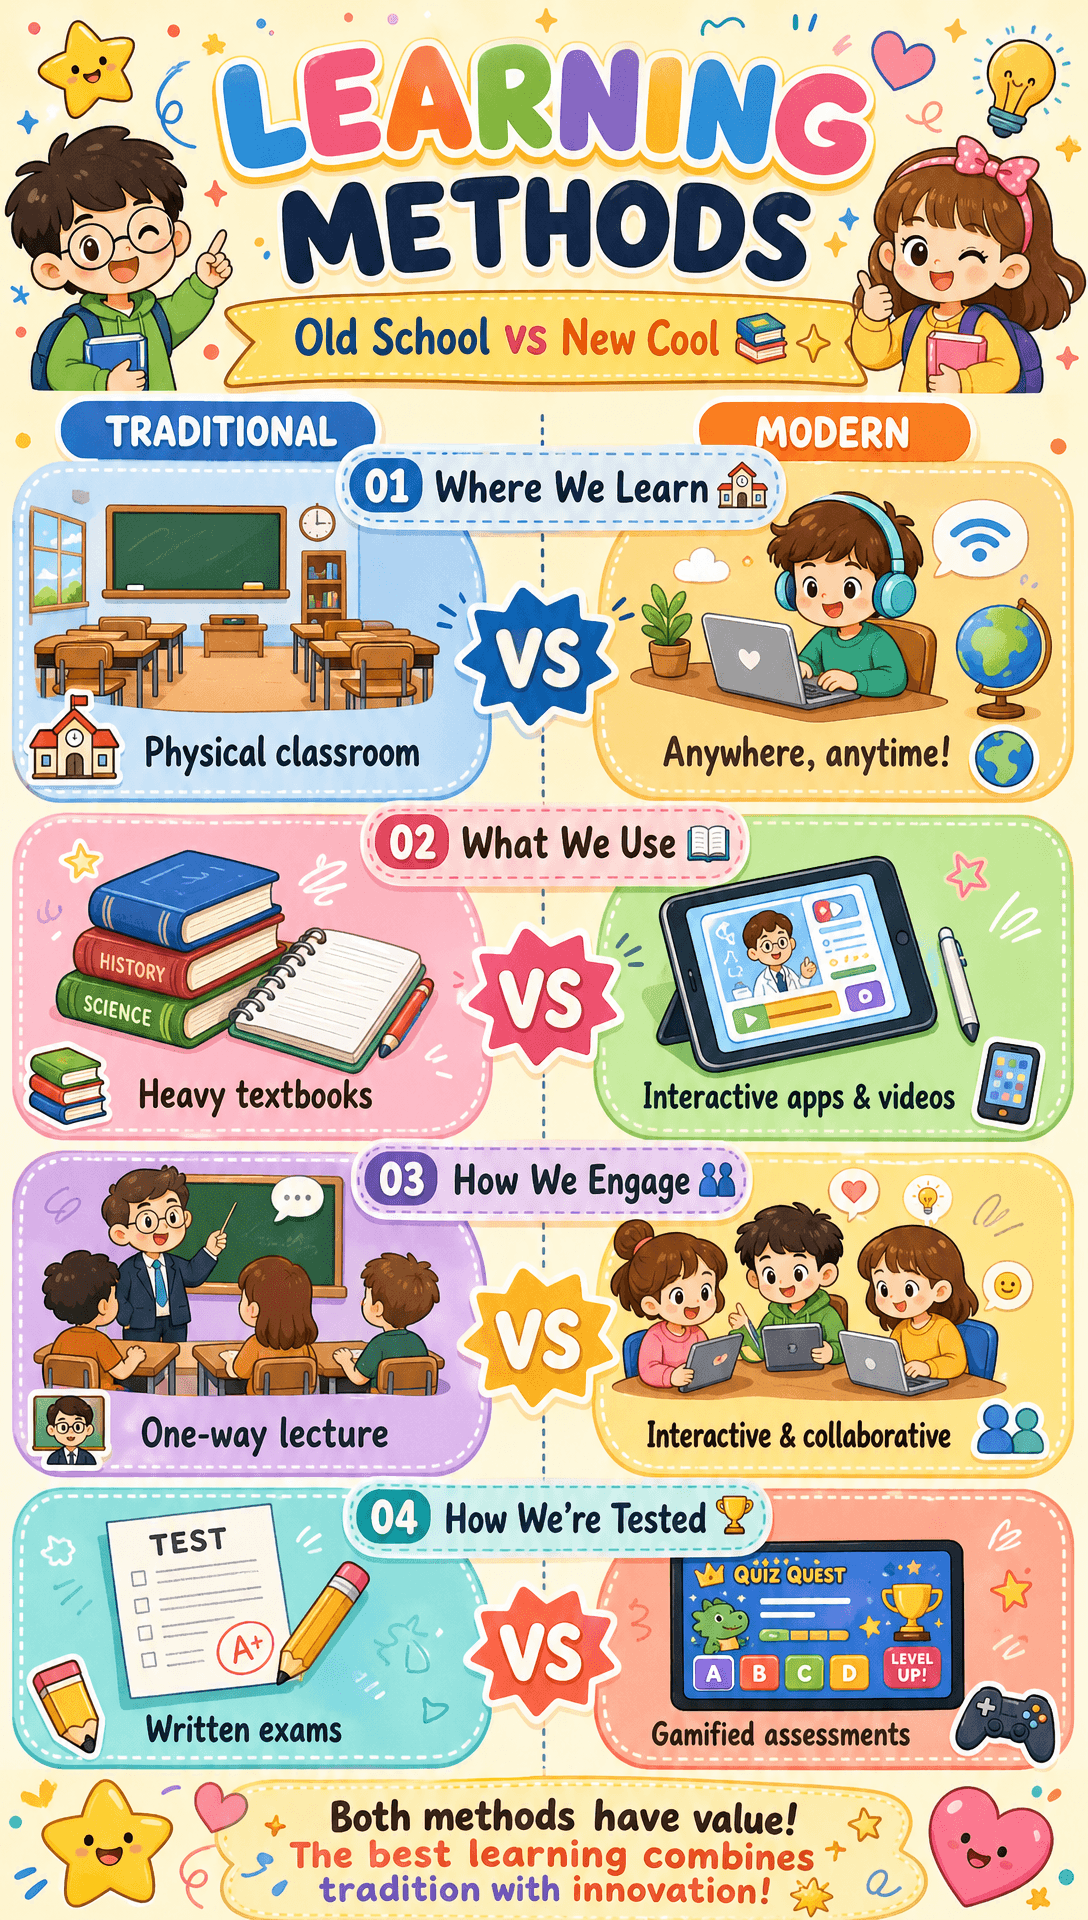

FormaLM organizes the content for the format you chose. Review it before you publish or use it.
Decide whether the infographic should explain a comparison, sequence, system, process, or framework.
Add the notes, article, links, images, or document that contain the information worth preserving.
Select the claims, nodes, criteria, or stages that need to remain visible in the final structure.
Review the visual order, factual accuracy, labels, and density before using or sharing the result.
Check the facts, order, context, and visual choices.
FormaLM can begin with a content need, pasted text, notes, links, images, or document files. The source works best when it contains a clear relationship, comparison, sequence, process, or concept that can be compressed into a visual hierarchy.
A current infographic or single-image generation uses 12 credits. The product shows generation cost before creation, and plan allowances are listed on the pricing page.
Yes. Check the facts, labels, visual relationships, text density, and whether the design suggests anything the source does not support.
Bring your rough material and answer a few questions. FormaLM builds the prompt and creates the format on iPhone or on the web.