
What a survey results infographic needs to answer
A survey results infographic is a short visual explanation of a finding, not a picture of every question in the form. It should let someone identify who answered, what they were asked, what the answers show, and what the result cannot establish. A complete analysis can remain in a separate report. The infographic gives a reader a reliable entry point into it.
The Australian Bureau of Statistics' guide to presenting survey results treats the methodology, findings, and possible action as connected parts of the report. A one-page visual has less room, but it still needs that connection. A striking percentage without its question or response base is difficult to interpret.
Write a one-sentence purpose before designing. For example: “Show a project team which onboarding step respondents found hardest, so it can decide what to investigate next.” That sentence tells you which results belong and which are background. If the audience instead needs to inspect every subgroup or question, use a report or dashboard. A research summary can carry the fuller evidence and decision trail.
Prepare the numbers before design
Make a small evidence table from the actual survey export. For each figure you might display, record the exact question wording, response options, count of people who answered that question, count for each option, calculation, and any missing responses. Keep the original export available for review; do not ask a visual tool to infer the numbers from a screenshot.
| Check | Why it matters on the visual |
|---|---|
| Question wording and options | A shortened label must not change what respondents answered. |
| Response base for each question | Skipped questions can have different denominators. |
| Single-choice or multi-select | Multi-select percentages may add to more than 100%. |
| Sample and collection method | Results from respondents do not automatically describe everyone in the population. |
| Collection dates and source | Readers can tell what period the result covers and where to inspect it. |
An annotated University of Maryland survey example calls out the value of showing response rates, methods, source notes, and the distinction between survey respondents and the wider student body. Stats NZ's survey design guide likewise recommends disclosing limitations, including sample size and response rate where relevant. These details can be compact, but they should not vanish when a report becomes an infographic.
For a multi-select question, say “respondents could choose more than one” beside the chart. Calculate each option's share against the people who answered that question, unless the survey's analysis plan specifies another base. Never force the bars to total 100% when each person could choose several options. For a rating scale, retain the scale endpoints and direction. When comparing groups, show each group's base rather than implying equal sample sizes.
Choose a finding and visual structure
Choose one headline finding that the audience can act on or investigate. Then select at most a few supporting numbers. The format should follow the relationship in the data:
- Parts of one single-choice answer: use a labeled bar chart or another part-to-whole view with the same response base.
- Several choices or priorities: use horizontal bars ordered by count; label multi-select questions explicitly.
- Change over time: use a time series only when the same measure and comparable collection method exist at each point.
- Qualitative comments: use a short theme summary with its coding method. Do not turn a few selected quotes into a quantified finding.
Use direct labels instead of making the reader decode a legend. Start a bar axis at zero, preserve meaningful differences, and keep chart lengths tied to the checked values. If a claim needs many caveats, a web page format may be the more honest choice. If the main task is choosing between two options rather than reporting a survey, use the comparison infographic method.
A worked survey infographic example
The following workshop survey is fictional. None of the numbers are FormaLM usage data or a real research result. Imagine 40 participants received a short survey after a training session. All 40 answered a single-choice question about the hardest step. Only 36 answered a separate satisfaction question. Those questions must not share an unlabeled denominator.
| Question | Fictional result | Safe display label |
|---|---|---|
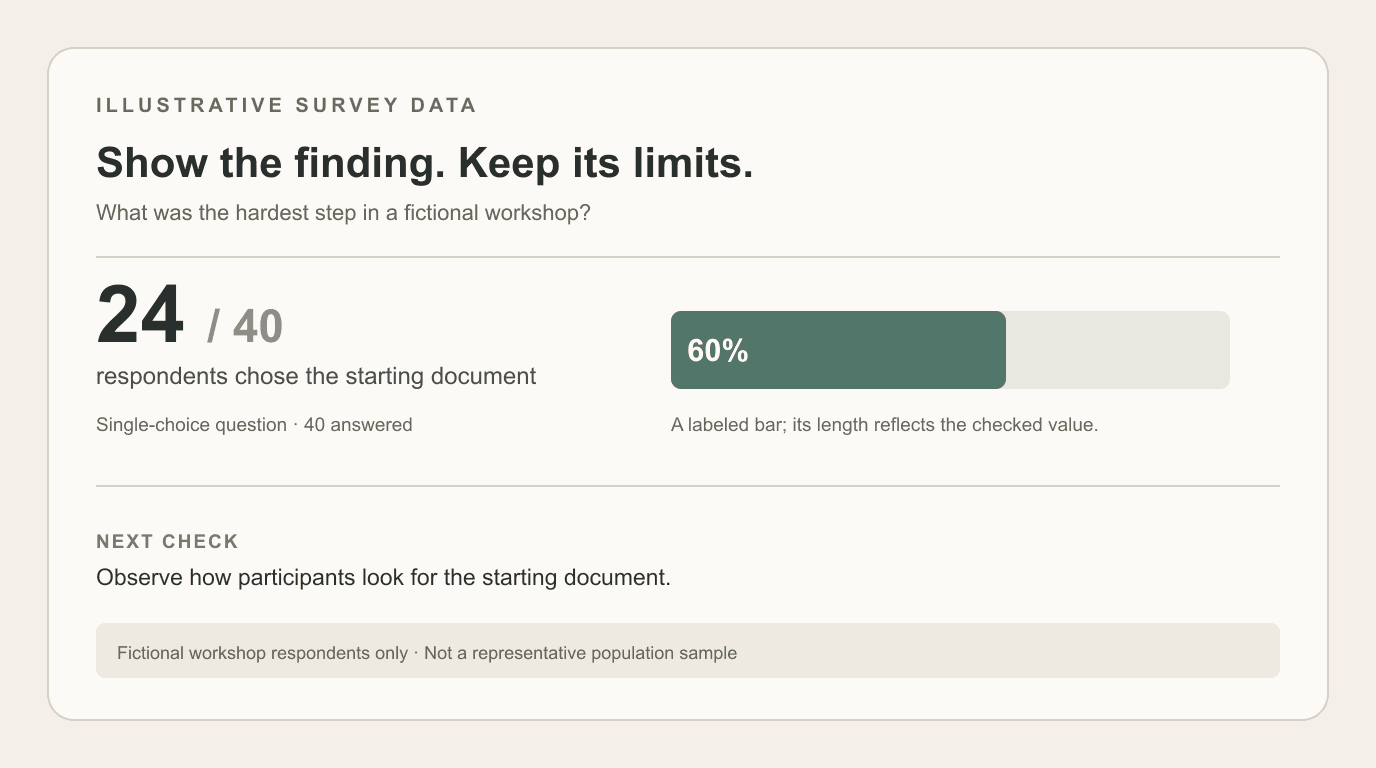
| “Which step was hardest?” | 24 of 40 chose “finding the right starting document” | “24 of 40 respondents (60%) chose the starting document.” |
| “Was the session useful?” | 27 of 36 selected “yes” | “27 of 36 who answered this question (75%) selected yes.” |
| “What help would you use?” | 20 of 38 chose a checklist; 18 chose an example; multiple choices allowed | Show two bars and note that respondents could select more than one. |
The infographic's headline could be “The starting document was the main obstacle in this workshop survey.” A single bar chart shows the first question, with n=40 next to it. A smaller box gives the proposed next check: observe where participants look for that document before redesigning the training. A footer states the fictional collection setting, the question wording, and “workshop respondents only; not a representative population sample.” The second and third questions can be omitted if they distract from the decision.
This layout makes the finding visible without claiming that 60% of all potential users have the same problem. It also leaves space for the source report or raw summary. The example image above shows that information hierarchy; its numbers are illustrative, not survey evidence.
Draft the infographic in FormaLM
FormaLM supports infographic creation from a goal and source material such as pasted text, links, documents, or images. Prepare the checked evidence table first, then state the audience, one headline finding, the exact figures to use, and the caveats that must remain visible. Ask for a visual that separates the finding, evidence, and methods note. Review the draft before sharing it.
Do not assume an uploaded spreadsheet will be analyzed correctly or that a generated image will plot bars to exact numeric lengths. FormaLM shapes a visual draft; it is not a statistical analysis or chart verification system. For a result where precise plotted proportions are essential, make the chart in a data charting tool and use the infographic to explain the result around it. The AI draft readiness checklist offers a broader review method for source fidelity and handoff quality.
Check the finished visual against the source
Read every displayed value back against the evidence table. Verify each numerator, denominator, percentage, axis, category label, and quoted question. Confirm that a multi-select chart is labeled, that any subgroup comparison shows its bases, and that the headline does not claim more than the sample supports. Ask a person unfamiliar with the survey what they think the visual means; if their answer exceeds the evidence, revise the headline or caveat.
Finally, check the destination. A social post may need one finding and one chart. A project decision may need a linked report and an explicit next step. The infographic is finished when a reader can understand the result and its limit without opening the source, while still having a path to verify the detail.