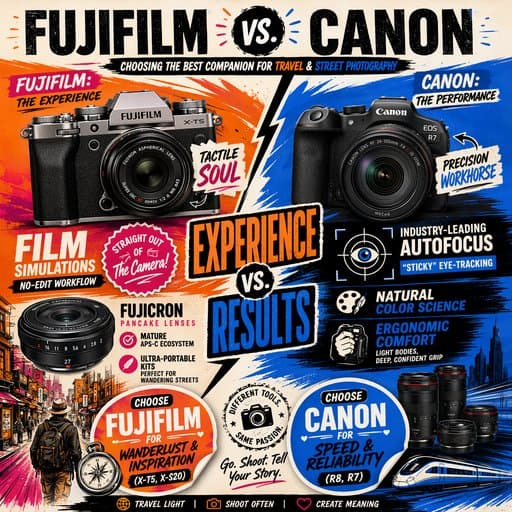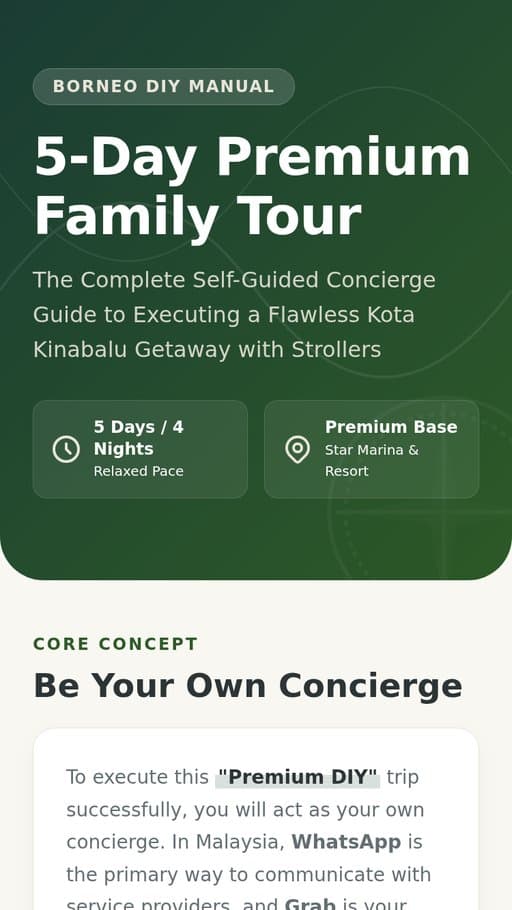
Concept infographic maker
Map the parts of a difficult idea in one scannable infographic.
See what this template can make
Real FormaLM outputs, shaped from different source material.
Bring the material. Choose the finish.
The template supplies the structure between the two.
- Start with
- TextLinksDocumentsImages
- Finish as
- Infographic
Start with a real task
Open the template with the job already in focus.
Questions that fit the task
Start with what you know. FormaLM asks for the details this task needs before generation.
Centers one difficult idea
Name the concept and the aspect that needs explanation. The page stays focused on that learning task.
Works from reference material
Add links, documents, and images when the concept needs definitions, evidence, or examples.
Shows relationships visually
The infographic structure makes hierarchy, sequence, contrast, and connection easier to scan.
Creates a finished composition
Move from a rough explanation to a designed infographic that can be refined before sharing.
Ways to use this template
Choose the situation closest to the work you need to finish.
- 01
Make a system understandable
Break the system into its essential parts and show the relationship that holds them together.
A visual map readers can scan before going deeper. - 02
Teach a framework
Present the stages, categories, or forces in a stable composition that supports recall.
A reusable aid for a lesson or discussion. - 03
Clarify an abstract idea
Pair the definition with a concrete example and the distinction readers often miss.
A focused explanation with less cognitive load.
Where the workflow starts
FormaLM begins with the task, source material, and intended format already defined.
| Decision | General AI chat | Manual tools | FormaLM |
|---|---|---|---|
| Starting point | An open request for an explanation | A blank visual canvas | One concept, a focus, and optional references |
| Information shape | Usually prose | Designed from notes | Parts, relationships, and takeaway |
| Reference material | Added in the conversation | Reviewed separately | Links, documents, and images |
| Output | Text or an isolated image | A manually assembled graphic | A structured, editable infographic |
Who this template helps
Use it when you know the job and want a structured first draft.
Educators and learning designers
Give learners a visual model before asking them to retain the details.
Product and technical teams
Explain systems, architecture, and workflows to non-specialists.
Researchers and publishers
Make one dense idea easier to discover, understand, and share.
Common questions
What you can add, which formats are available, and how to review the result.
What is a concept infographic?
It is a visual explanation centered on one idea, with the key parts, relationships, examples, and takeaway arranged for a quick scan.
Can I add source material?
Yes. Add reference links, documents, or images and state which aspect of the concept needs the clearest explanation.
What if I only have a rough idea?
Start with the concept and focus. FormaLM asks focused questions to complete the brief, then uses the infographic format to shape the information into a coherent composition.
Can I edit the infographic?
Yes. The generated result is a draft you can refine before exporting or sharing.
How is this different from an AI image generator?
The template starts with the information structure and explanatory intent, then creates a visual content format around them.
Related templates and formats
Choose another template when the material needs a different structure.